 MrGripper
The short answer
Across 87 studies and more than 18,000 people, the average difference between a person's dominant and non-dominant grip is 8.1% — not the 10% of clinical folklore. Yet a "greater than 10%" gap flags 53.4% of US adults over 50, and measurable health risk only appears consistently above 30%. A single test can't tell you which side of that you're on.
That's the number. The more useful thing this page gives you is why almost every threshold you'll read about is wrong in one direction or the other — and what to measure instead.
What "grip strength symmetry" actually means
Grip symmetry is the relationship between your two hands' maximum grip force. Researchers express it as a ratio, and there are two conventions worth knowing, because they aren't interchangeable:
- Strongest-over-weakest. Take the best reading from each hand and divide the higher by the lower. Every ratio comes out at or above 1.0, so it measures the size of the gap while ignoring which hand won. This is the method behind the large US prevalence figures below.
- Non-dominant-over-dominant. Divide the non-dominant hand by the dominant one. Ratios below 0.90 or above 1.10 count as asymmetric — the same 10% band, but it also tells you when the non-dominant hand is the stronger one, which is the more interesting case.
A ratio of 1.10 means one hand is 10% stronger than the other. Most published cut-points sit at 10%, 20%, and 30%.
Which convention a study uses changes what its numbers mean. That's the first reason grip-symmetry figures look so inconsistent across the internet.
What is a normal left–right grip difference?
The best current answer comes from a 2025 scoping review and meta-analysis that pooled 87 studies of upper-limb strength asymmetry. For handgrip specifically — drawn from over 9,300 participants — the dominant hand was 8.1% stronger than the non-dominant hand, and the right hand 6.3% stronger than the left.
That review also found asymmetry is highly regional. The shoulder showed the largest dominant-side advantage at 17.3%; the forearm the smallest at 4.7%. Grip sits near the bottom of that range. Whatever you know about asymmetry from shoulder or leg testing does not transfer to hands.
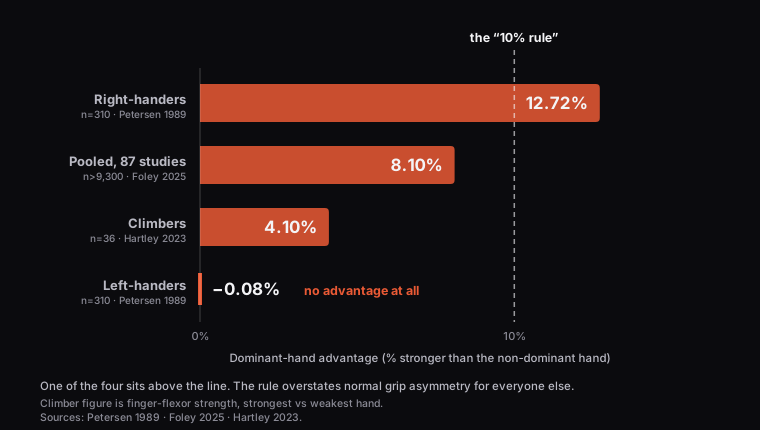
So the honest headline: a typical left–right grip gap is smaller than 10%, not equal to it.
Why the "10% rule" breaks down
The 10% rule — your dominant hand is about 10% stronger — is one of the most repeated claims in hand assessment. It fails in two opposite directions at once.
As a description of normal, it's too high. The pooled figure is 8.1%. And the rule collapses entirely once you split by handedness. Across 310 people, the average dominant-hand advantage was 10.74% — right on the folklore. But right-handers averaged 12.72%, while left-handers averaged −0.08%: no advantage at all.
If you're left-handed, your hands should be roughly equal. A 10% gap isn't your dominance showing up — it's an actual asymmetry. If you're right-handed, a gap in the low teens is unremarkable.
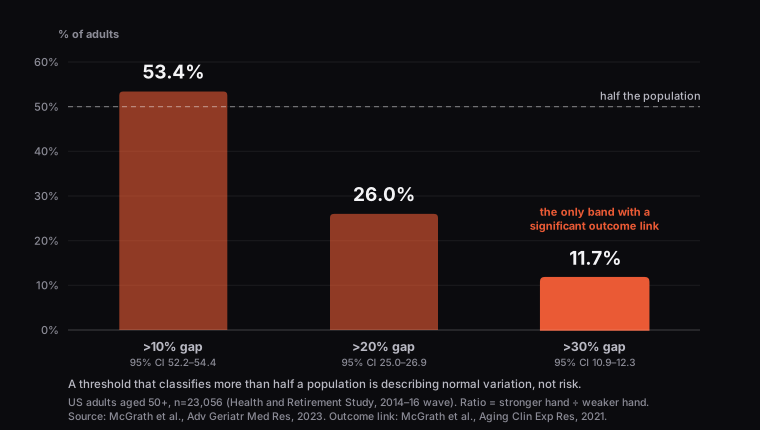
As a threshold for abnormal, it's far too low. This is where the rule does real damage. In the Health and Retirement Study — 23,056 Americans aged 50 and over — the prevalence of asymmetry greater than 10% was 53.4% (95% CI 52.2–54.4). A cut-off that classifies the majority of a population as abnormal isn't identifying a problem. It's describing normal variation.
The same study found 26.0% exceeded a 20% gap and 11.7% exceeded 30%. Those numbers barely moved across three survey waves from 2006 to 2016 — there were no statistically significant trends over time. Older adults were consistently more asymmetric than middle-aged ones (13.4% versus 10.1% above the 30% threshold).
At what point does a gap actually matter?
Here the research is clearer than most summaries admit, and the answer is reassuring for anyone who just measured a 12% difference.
In a study of 10,446 Americans aged 65 and over, greater asymmetry was associated with more future falls — but when broken into bands, only the greater-than-30% group reached significance (odds ratio 1.15, 95% CI 1.01–1.33). The 10.1–20% band (odds ratio 1.06, CI 0.98–1.14) and the 20.1–30% band (odds ratio 1.10, CI 0.99–1.22) did not.
Read that carefully. The band that catches half the population is the band with no significant association. Other work has linked asymmetry to outcomes including pre-dementia syndromes, generally finding the effect strongest when asymmetry and overall weakness occur together rather than asymmetry alone.
Interpretation bands. The table below is a reading aid, not a clinical instrument — it maps the cut-points the literature actually uses onto plain language. The prevalence column is derived from the three published thresholds above.
| Left–right gap | How common (US, 50+) | What it reasonably means |
|---|---|---|
| Under 5% | — | Well inside typical, and inside measurement error |
| 5–10% | ~47% sit below 10% | Typical, especially for right-handers; unremarkable for left-handers only at the low end |
| 10–20% | ~27% | Common. No significant outcome association at this band |
| 20–30% | ~14% | Uncommon but not rare; worth watching the trend |
| Over 30% | ~12% | The only band with consistent outcome associations across studies |
One rule cuts across every band: a gap that is stable is a different thing from a gap that is growing. No cross-sectional cut-point can tell those apart. Only repeat measurement can.
This is population research, not a diagnosis. The studies above describe groups, not people, and none of them can tell you anything about your own hands. A gap that appeared suddenly, follows an injury, or comes with pain, numbness, or loss of function is a reason to see a clinician or physio — not a reason to consult a table.
Can a single test even detect a 10% gap?
This is the question almost nobody asks, and it undercuts most of what's written about grip asymmetry.
Every measurement carries error. The standard way to express it is the minimal detectable change — the smallest difference that exceeds the noise of the instrument and the person using it. For grip dynamometry in a study of 109 patients, test–retest reliability was excellent (ICC 0.974) and yet the minimal detectable change was 5.0 kg, with a standard error of measurement of 1.8 kg.
Now put that next to the norms on average grip strength by age: median grip peaks at 49.7 kg for men and 29.7 kg for women. Five kilograms is therefore roughly 10% of a typical man's reading and about 17% of a typical woman's — that comparison is our arithmetic across two sources, not a figure either study reports.
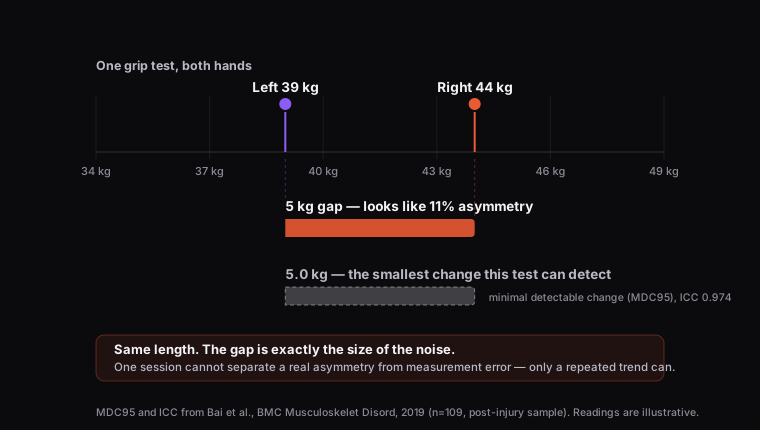
The implication is blunt. On a single test, a 10% left–right gap is indistinguishable from measurement noise — and for most women, so is a 15% gap. If you test once, see 44 kg and 39 kg, and conclude you have an imbalance, you have not measured an imbalance. You've measured one pair of readings that a repeat test could easily reverse.
That is not an argument against measuring. It's an argument against measuring once. Error is random; a real asymmetry is systematic. Six tests over six weeks separate them. One test can't.
What about athletes?
Nearly all the asymmetry research above studies adults over 50, because it grew out of geriatrics. If you train grip deliberately, the directly relevant evidence is thinner — but it exists, and it points the same way.
Climbers. Thirty-six experienced male climbers were tested for one-arm maximal isometric finger flexor strength. The mean difference between strongest and weakest hand was 4.1%, and handedness explained 89% of the variation. Neither preferred style — bouldering or sport — nor ability level (advanced or elite) explained the asymmetries. The authors' own recommendation: practitioners should regularly monitor unilateral strength to keep large asymmetries from developing.
Note what that finding rules out. Getting stronger or more skilled does not make you more symmetrical. Elite climbers weren't more balanced than advanced ones. For the training side of that, see grip strength training for climbing.
Grapplers and lifters. A study of 120 men across judo, Brazilian jiu-jitsu, bodybuilding, and a control group found grip asymmetry differed by sport in a way that defies the obvious guess. Absolute grip asymmetry was lowest in the jiu-jitsu athletes (1.45 ± 1.33) and highest in the bodybuilders (2.77 ± 2.14) — higher than untrained controls (2.06 ± 1.34). Judo athletes showed the greatest muscular asymmetry overall while sitting mid-pack on grip.
The pattern worth taking from this: bilateral, both-hands-equal training doesn't guarantee equal hands, and asymmetric sport demands don't automatically produce asymmetric grip. Your sport is a poor predictor of your own numbers. Only your own numbers predict your own numbers.
How to measure your symmetry so the number means something
Six things, in order of how much they matter:
- Test both hands, every time. Testing only the dominant hand throws the symmetry signal away entirely. It's the most common mistake and the most costly.
- Use the same device, same position, same order. Different dynamometers give different readings on the same hand — comparisons across devices are not valid. Pick one and stay with it.
- Take the best of three per hand, and record each hand separately rather than as a single merged number.
- Repeat before you conclude anything. One session establishes nothing about symmetry. Four to six sessions establish a trend.
- Watch the gap over time, not the gap today. A stable 12% gap in a right-hander is unremarkable. A 6% gap that becomes 18% over three months is a real finding — and it's invisible unless each hand is logged separately.
- Recheck after any layoff or injury on one side. That's when gaps open, and when closing one is the actual training goal.
For the full testing protocol, including what to do without a dynamometer, see how to test grip strength at home.
Method and limitations
Being explicit about what this page is:
- This is a synthesis of published research, not original data. Every figure is sourced to a peer-reviewed study, listed below with the numbers as published. MrGripper does not collect grip readings — the app is offline-first and stores your data on your device, and its App Store privacy label covers only anonymous usage data and diagnostics. There is no central database of user grip measurements to report on, by design.
- The literature skews old and clinical. The large prevalence and outcome studies sample adults 50 and over; the athlete studies are small (36 climbers, 120 grapplers and lifters) and male. Treat the athlete numbers as indicative rather than definitive.
- Cut-points are conventions, not biology. The 10 / 20 / 30% bands are analytical choices researchers made, and reviewers have called for better-validated cut-offs. Some evidence favours 20% or 30% over 10%.
- One number is derived, not cited. The comparison of a 5 kg minimal detectable change against median peak readings is our arithmetic across two sources, and the minimal detectable change itself was measured in a post-injury population. A figure from healthy trained adults would be a better input; we haven't found one we can cite, so the comparison is offered as a rough sense of scale rather than a precise threshold.
- Retrieved 1 August 2026. Research moves; the asymmetry literature has grown quickly since 2020.
Where this leaves you
Grip symmetry is one of the few strength metrics where the popular threshold is not just imprecise but actively misleading. The 10% rule overstates what's normal, understates what's concerning, and sits so close to measurement error that a single test can't resolve it.
What survives all that is simple: log each hand separately, keep the protocol identical, and read the trend rather than the reading. The gap you can act on is the one that moves.
Tracking your own left–right gap with MrGripper
A ratio from one session is a snapshot with a wide error bar. A tracked history is the only thing that separates a real asymmetry from a noisy afternoon.
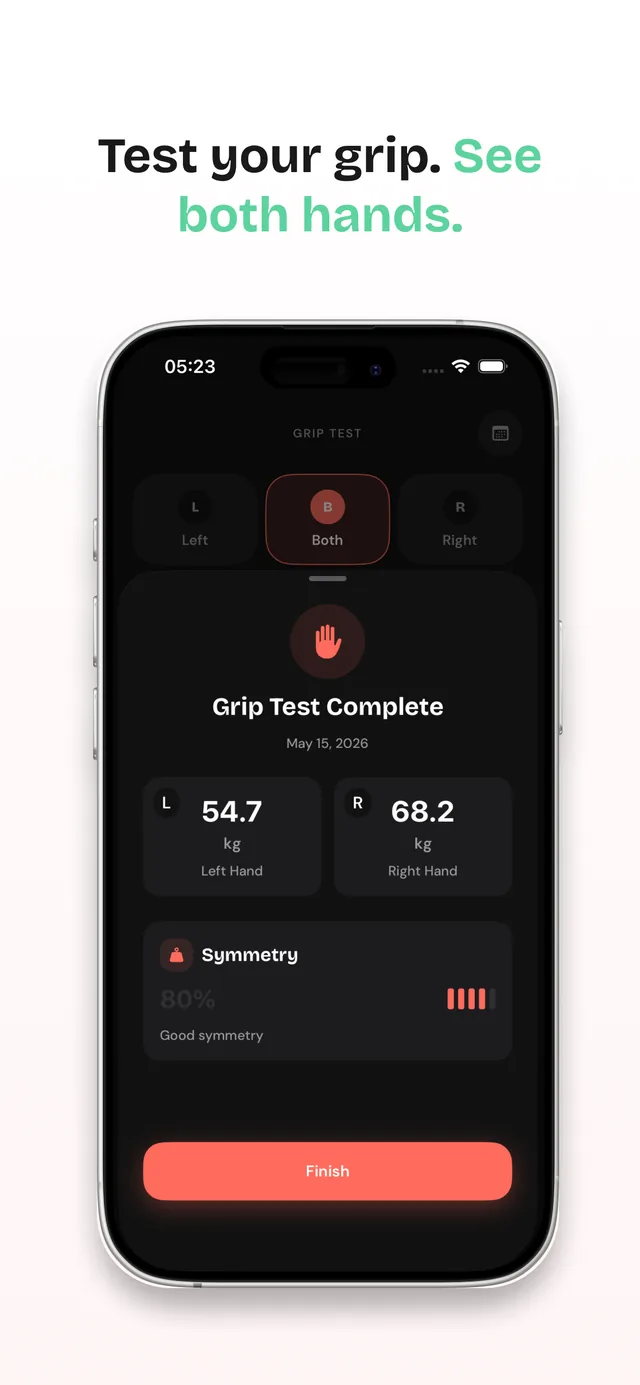
The grip-test flow is built for exactly this:
- Run a grip test for the left hand, the right hand, or both, and type in your dynamometer readings in kg or lbs. There's no pairing step — you read the number off whatever dynamometer you already own, which is what lets the app work with any device.
- Each hand's history is kept separate, and the app scores your left–right symmetry as a percentage, so a lagging hand is visible instead of buried in an average.
- Insights chart the trend per hand over weeks — which is how a gap that's growing becomes obvious while it's still small.
Per-hand tracking and dynamometer grip tests are in the free tier. There's an optional Pro subscription ($4.99/month or $29.99/year) that adds full history, longer insight windows, per-equipment and per-load PRs, and CSV export — compared side by side on free vs Pro.

See where you stand.
Grip Strength: MrGripper is free on the App Store — log grip tests per hand and watch your symmetry trend against your own history.
FAQ
Is one hand supposed to be stronger than the other?
Usually, but by less than you've been told. Pooled across 87 studies, the dominant hand is about 8.1% stronger. That average hides handedness: right-handers show roughly a 12.7% advantage, while left-handers show essentially none (−0.08%). If you're left-handed, near-equal hands are the expectation, so a 10% gap is a real asymmetry rather than normal dominance.
What counts as too much grip asymmetry?
No threshold is well validated, but the evidence clusters at 30%. Gaps above 30% are the only band consistently associated with outcomes such as future falls; gaps between 10% and 30% showed no significant association in that data. A gap over 10% describes 53.4% of US adults over 50, which is why it works poorly as a warning line.
Why is my grip weaker in one hand?
A lower reading can reflect normal asymmetry or a difference in the way the two hands were tested. Hand dominance does not reliably predict which side will be strongest. Our guide to why one hand can test weaker explains how to repeat the comparison without turning one number into a diagnosis.
How do I measure grip symmetry at home?
Test both hands with the same dynamometer in the same position, take the best of three per hand, and divide the stronger reading by the weaker one. A result of 1.10 is a 10% gap. Repeat over several weeks — the trend is the finding, not any single session.
Does training one hand more fix asymmetry?
The research is thin, and none of the studies cited on this page tested an intervention. What the evidence does show is that asymmetry isn't erased by getting stronger overall — elite climbers were no more symmetrical than advanced ones — so extra volume alone is not a reliable fix. Track the gap and treat a growing one as the signal.
Is the 10% rule for grip strength accurate?
Not in either direction. As a description of normal it's too high: the pooled figure across 87 studies is 8.1%, and left-handers average no advantage at all. As a threshold for abnormal it's too low, flagging 53.4% of US adults over 50 in a band with no significant outcome association.
Sources
- Pooled handgrip asymmetry (8.1% dominant/non-dominant, 6.3% right/left) and the regional comparison — Foley RCA, et al. A comprehensive scoping review and meta-analysis of upper limb strength asymmetry. Sci Rep. 2025;15:4636.
- US prevalence at the 10 / 20 / 30% thresholds and the wave trends — McGrath R, et al. Prevalence and Trends of Handgrip Strength Asymmetry in the United States. Adv Geriatr Med Res. 2023;5(2):e230006.
- The falls association by asymmetry band — McGrath R, et al. Handgrip strength asymmetry is associated with future falls in older Americans. Aging Clin Exp Res. 2021;33(9):2461–9.
- Asymmetry with weakness and pre-dementia syndromes — Jia S, et al. Association of Handgrip Strength Weakness and Asymmetry With Incidence of Motoric Cognitive Risk Syndrome. Neurology. 2023;100(23):e2342–9.
- The 10% rule by handedness — Petersen P, et al. Grip strength and hand dominance: challenging the 10% rule. Am J Occup Ther. 1989;43(7):444–7.
- Measurement error and minimal detectable change — Bai Z, et al. Test-retest reliability and measurement errors of grip strength test in patients with traumatic injuries in the upper extremity. BMC Musculoskelet Disord. 2019;20:256.
- Climber bilateral asymmetry — Hartley C, et al. Handedness, Bilateral, and Interdigit Strength Asymmetries in Male Climbers. Int J Sports Physiol Perform. 2023;18(12):1390–7.
- Grip asymmetry by sport — Burdukiewicz A, et al. Asymmetry of Musculature and Hand Grip Strength in Bodybuilders and Martial Artists. Int J Environ Res Public Health. 2020;17(13):4695.
- Median peak readings used in the measurement-error comparison — Tomkinson GR, et al. International norms for adult handgrip strength: data on 2.4 million adults from 69 countries and regions. J Sport Health Sci. 2025.